CEEW Data Book
Deliverables:
- Publication Design
- Infographic Design
The first-of-its-kind data book on the world’s largest clean energy transformation
India’s energy transition is rewriting the global growth story. With 1.45 billion people, it’s the fastest-growing major economy and a nation aiming for net-zero emissions by 2070.
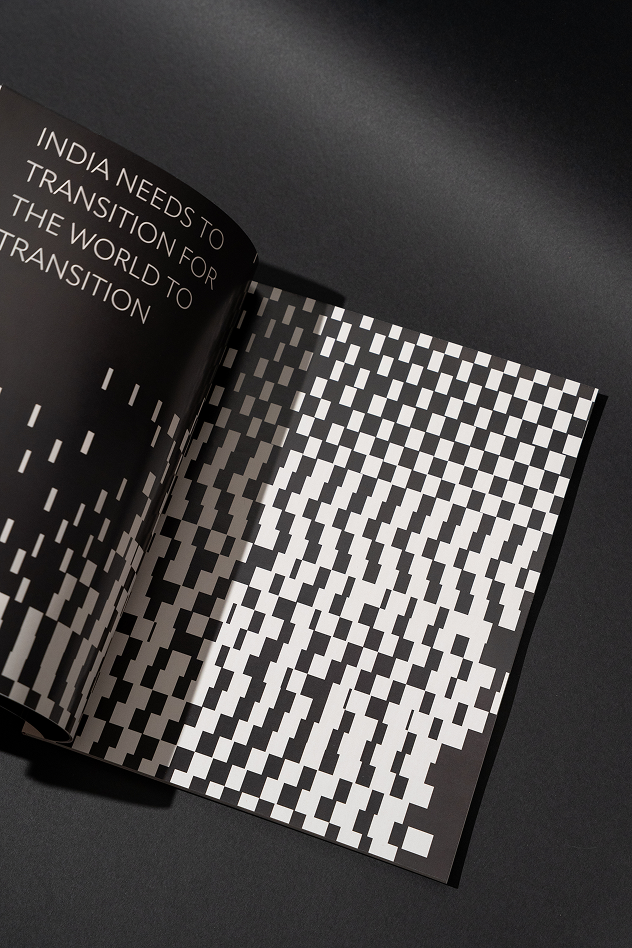
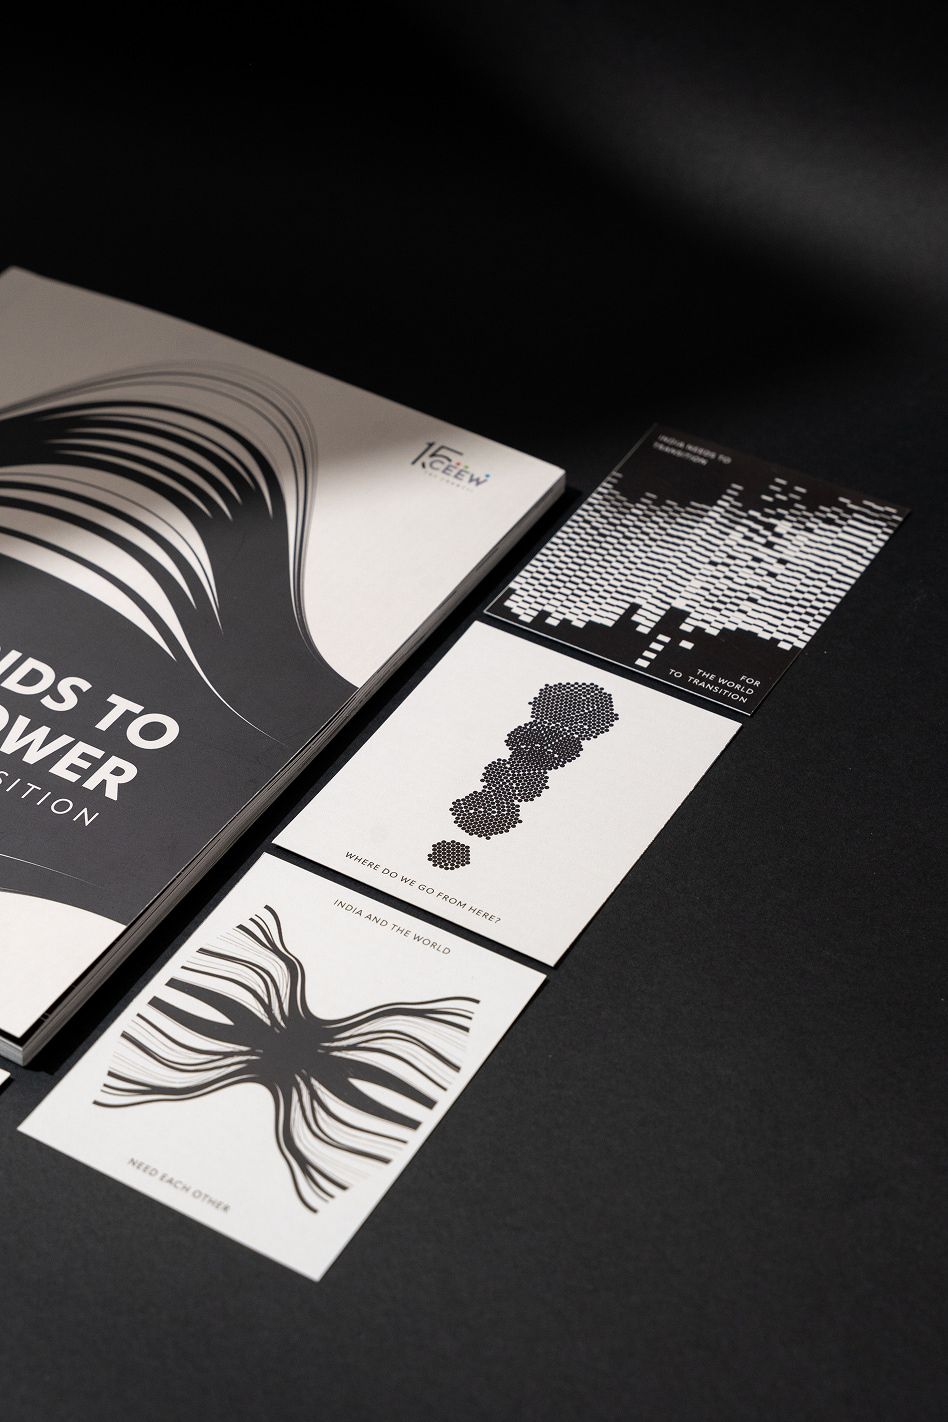
With 1.45 billion people, it’s the fastest-growing major economy and a nation aiming for net-zero emissions by 2070
This data-driven chronicle captures how India is electrifying every home, scaling renewables from megawatts to gigawatts, and pioneering fuels of the future like green hydrogen.
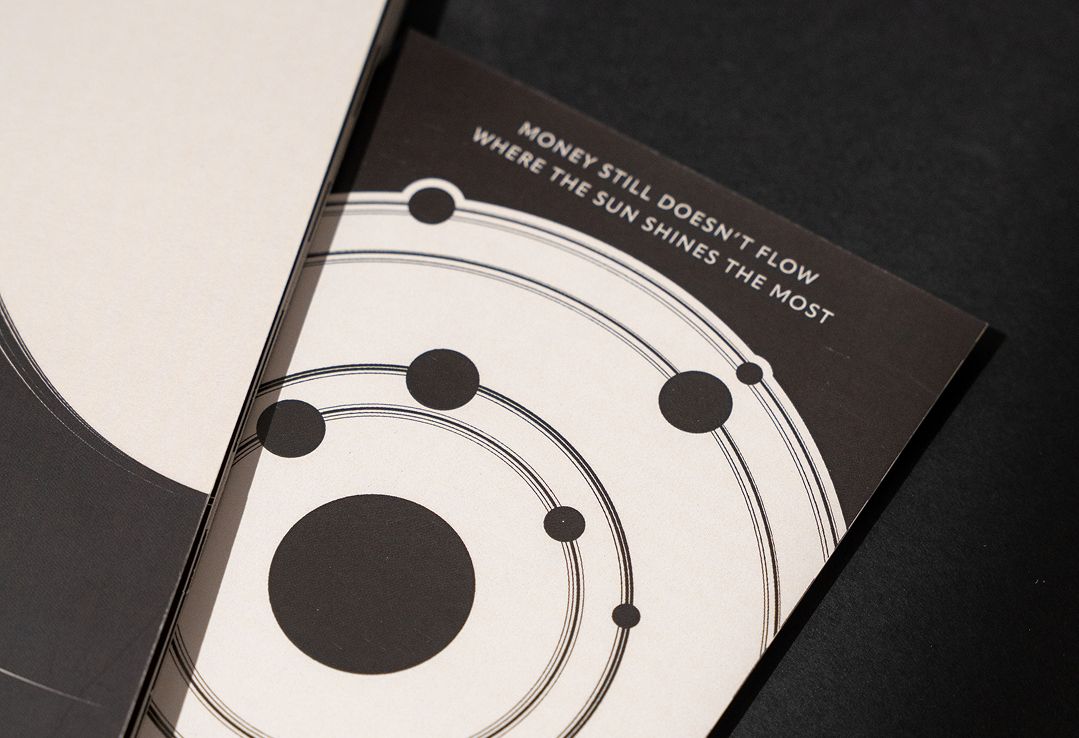
From solar villages to smart grids, digital subsidies to global alliances, India is showing that decarbonization and development can go hand in hand.
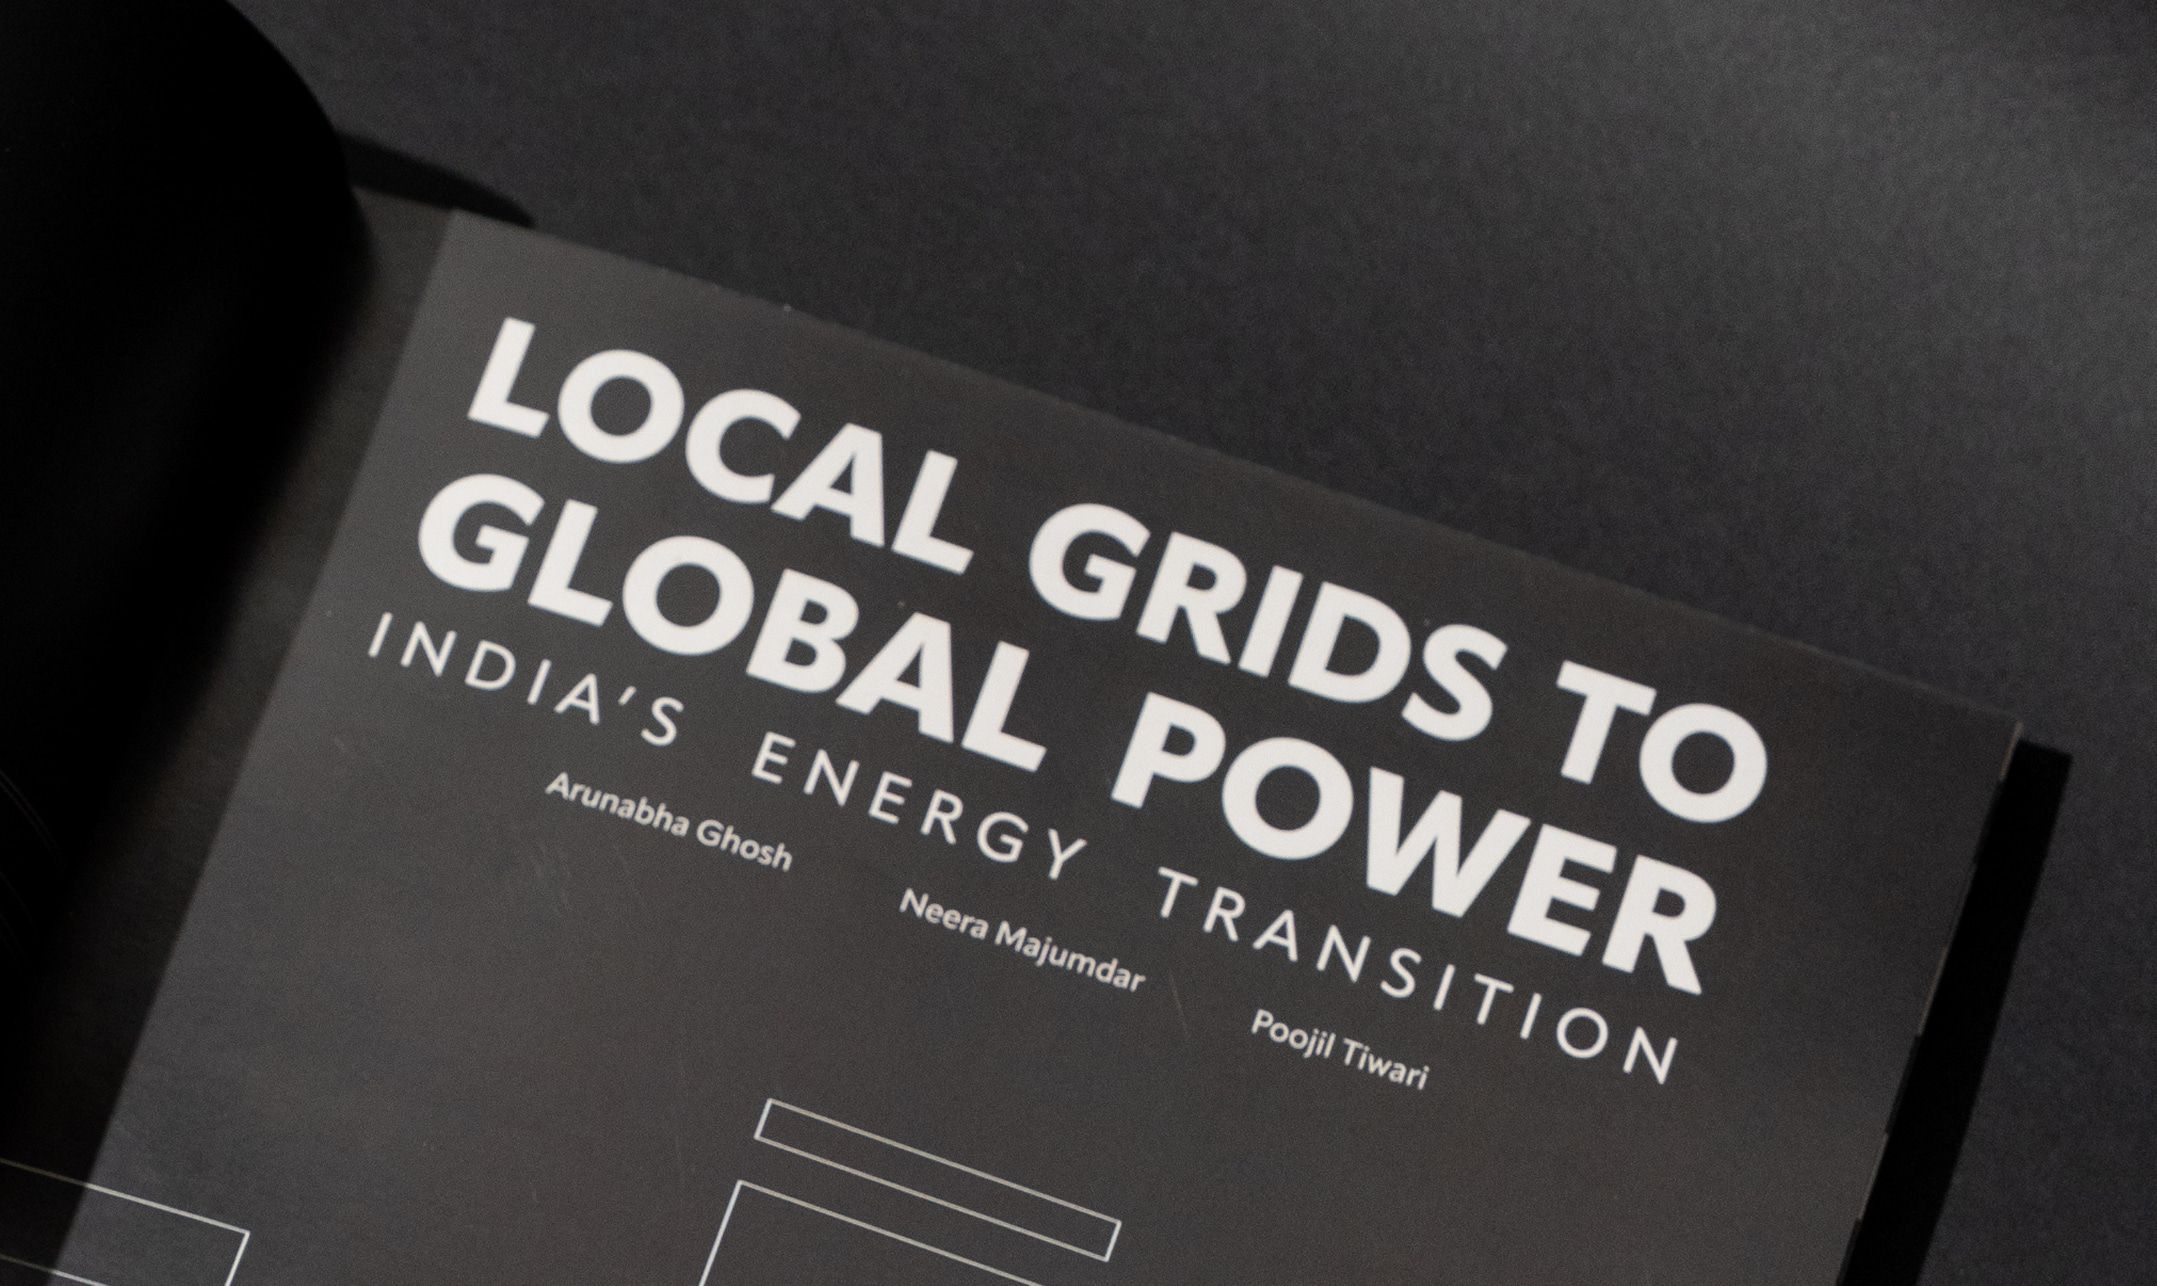
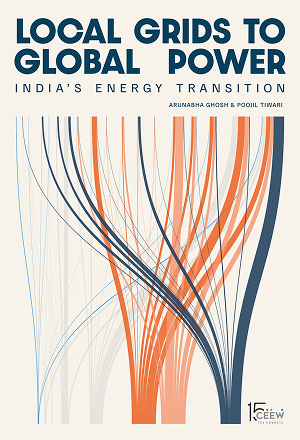
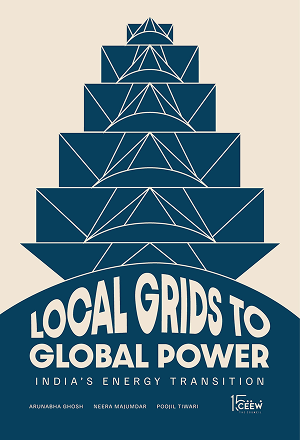
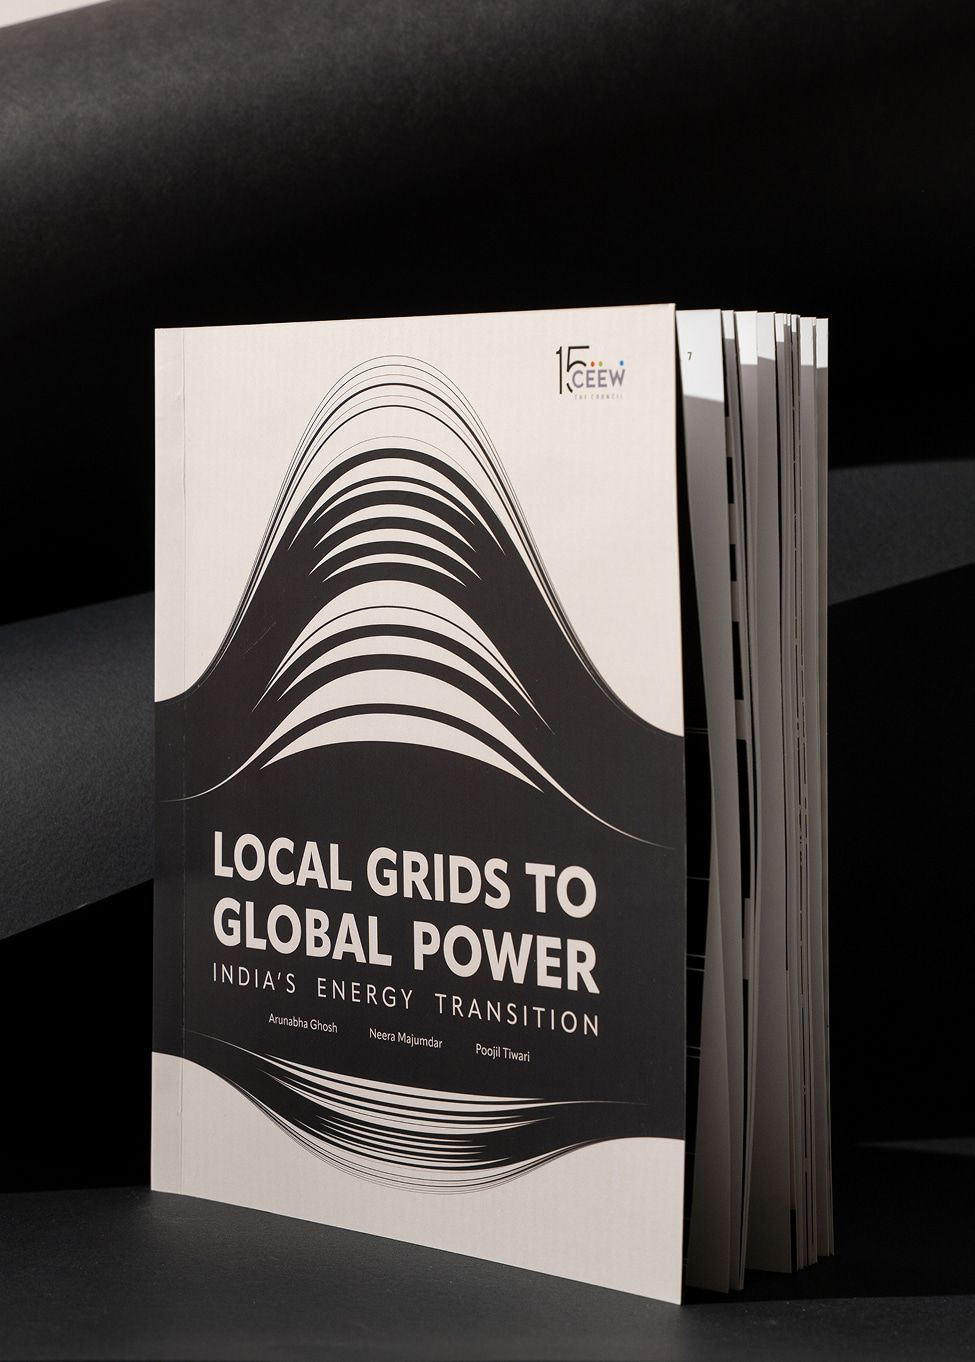
Local Grids to Global Power reveals the numbers, the networks, and the new geopolitics of clean energy — and how a country’s choices could determine the planet’s climate future and give a blueprint for the Global South. - Poojil Tiwari, Neera Majmudar, Arunabha Ghosh.
This data-visualisation-led research was also presented at COP (United Nations Climate Change Conference) 2025 in Belém, Brazil.
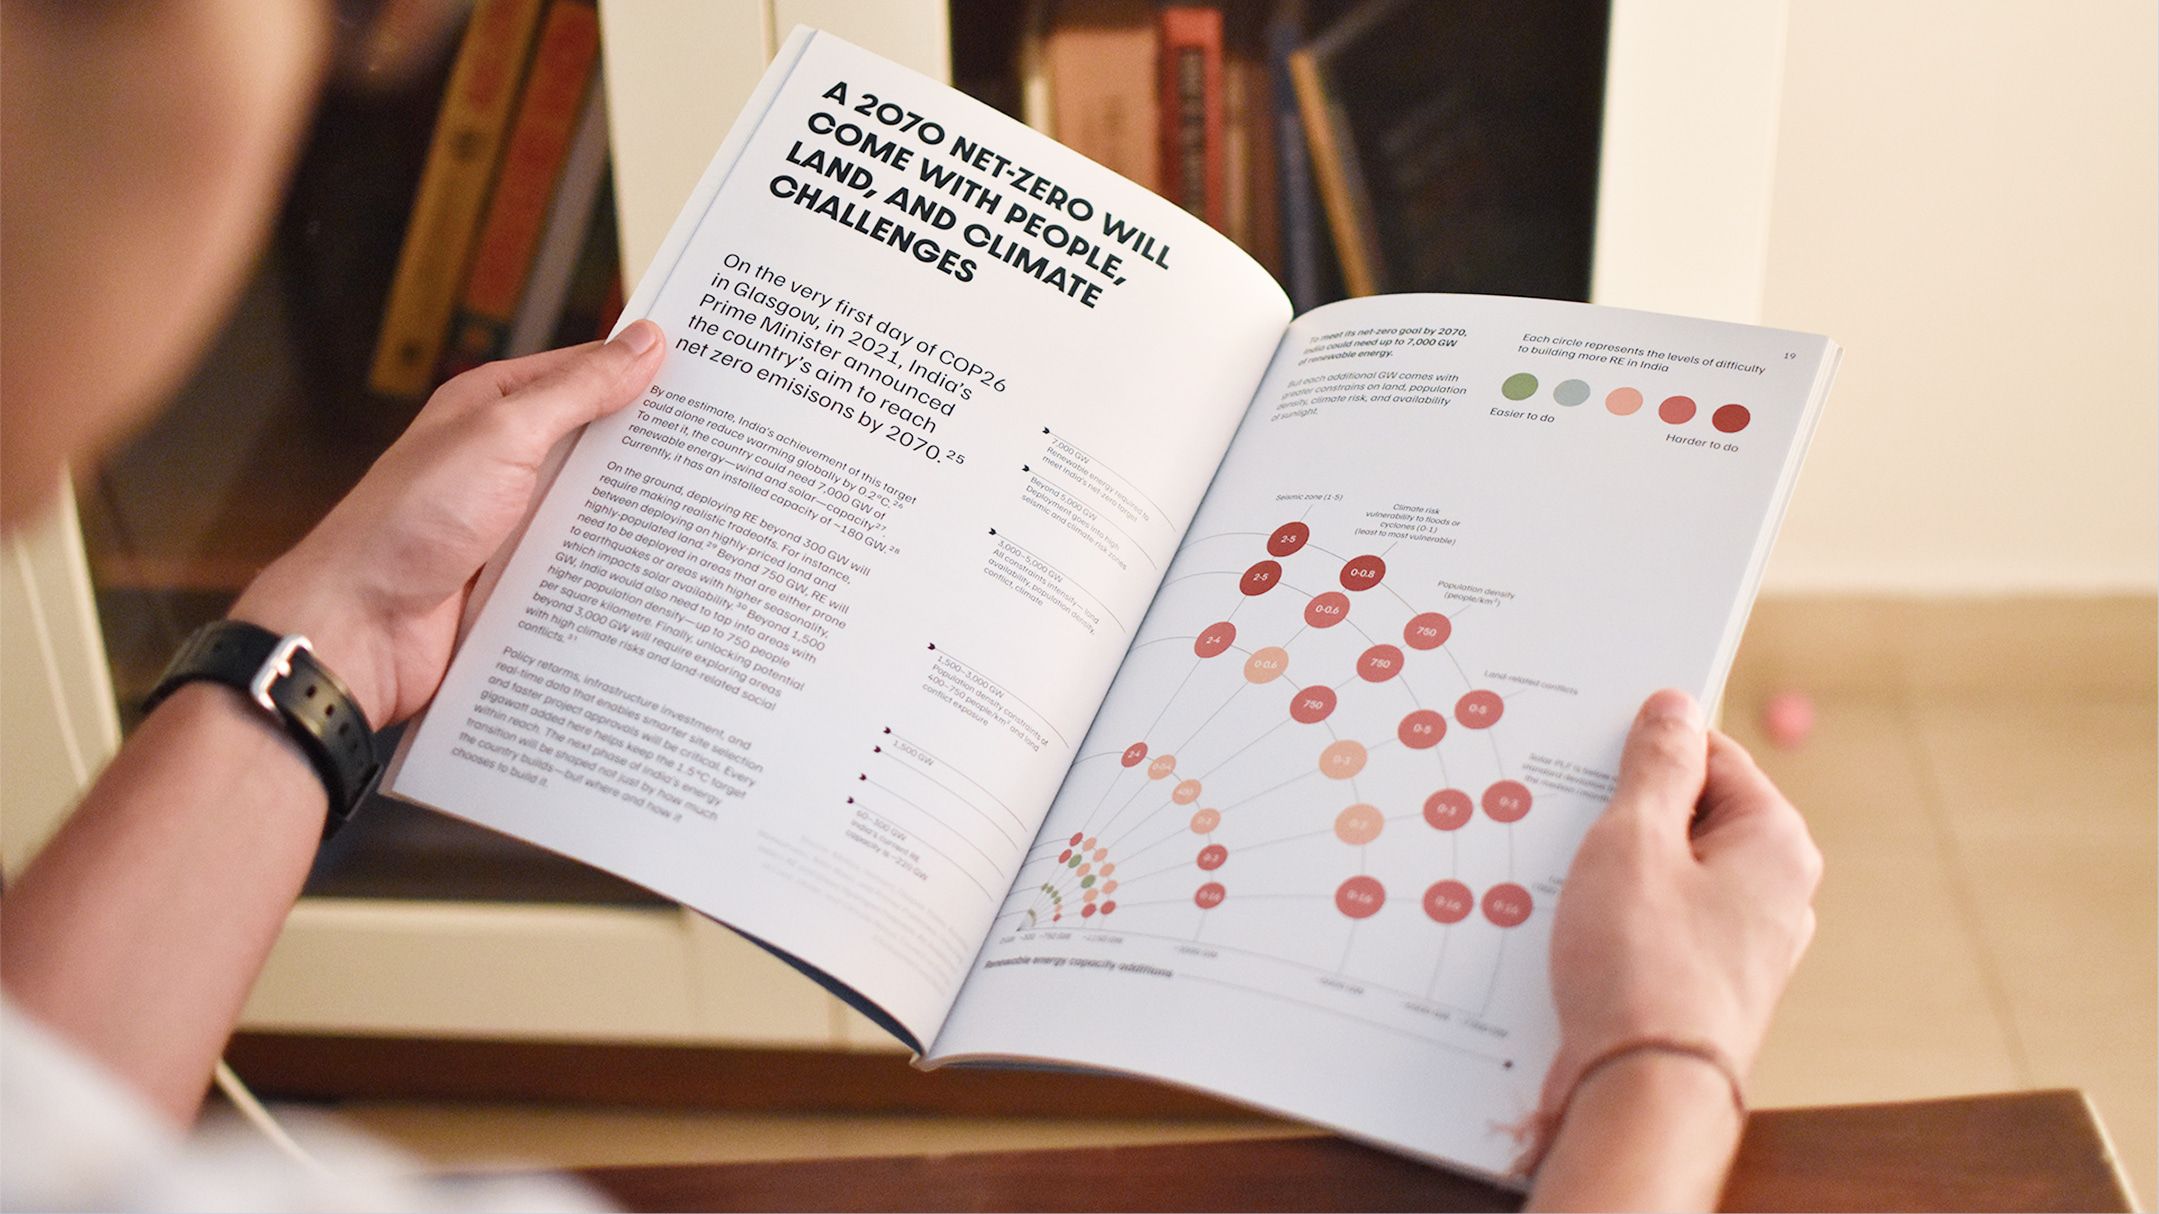
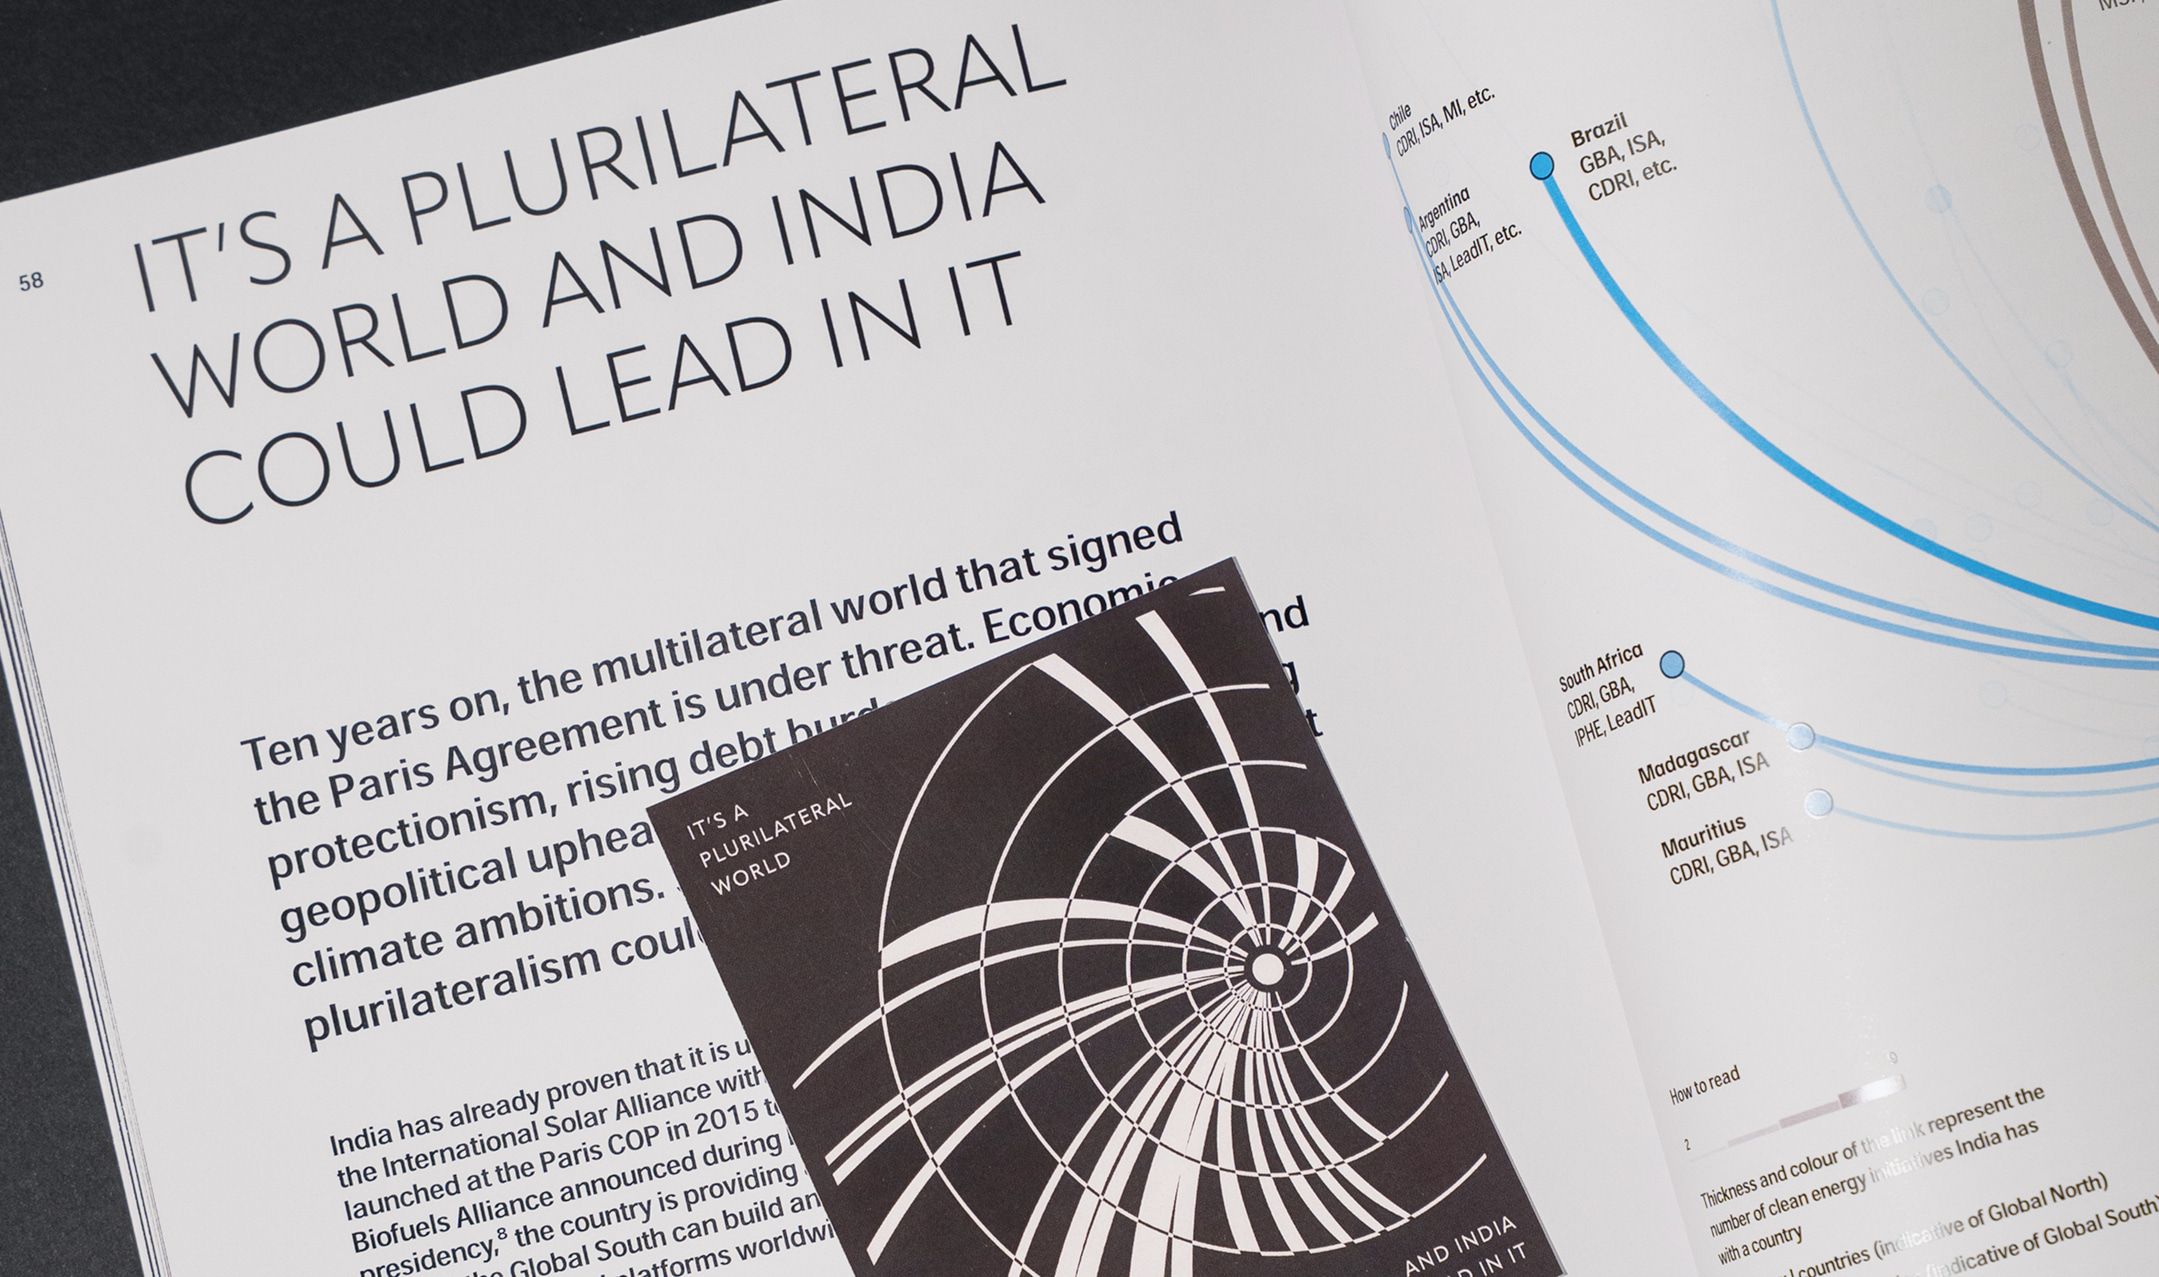
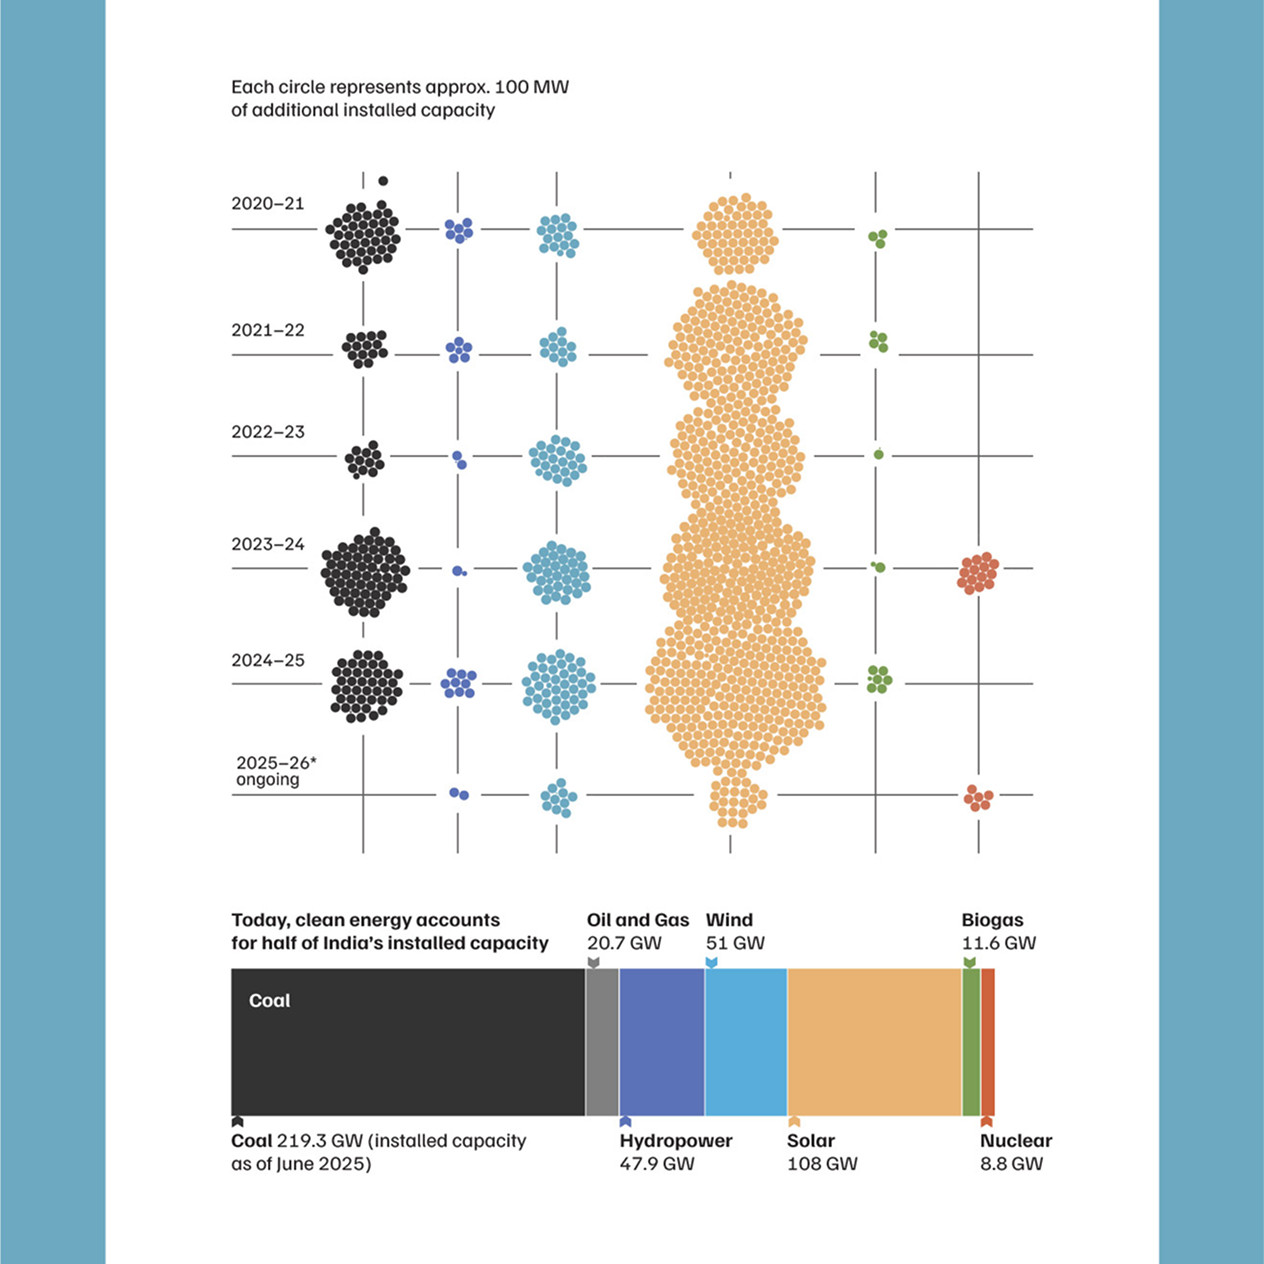
The key research writing and data charts (which makes up for most of the book), are organised in a clean manner with simple and clear visual hierarchy. Same typologies of content appear in similar places.
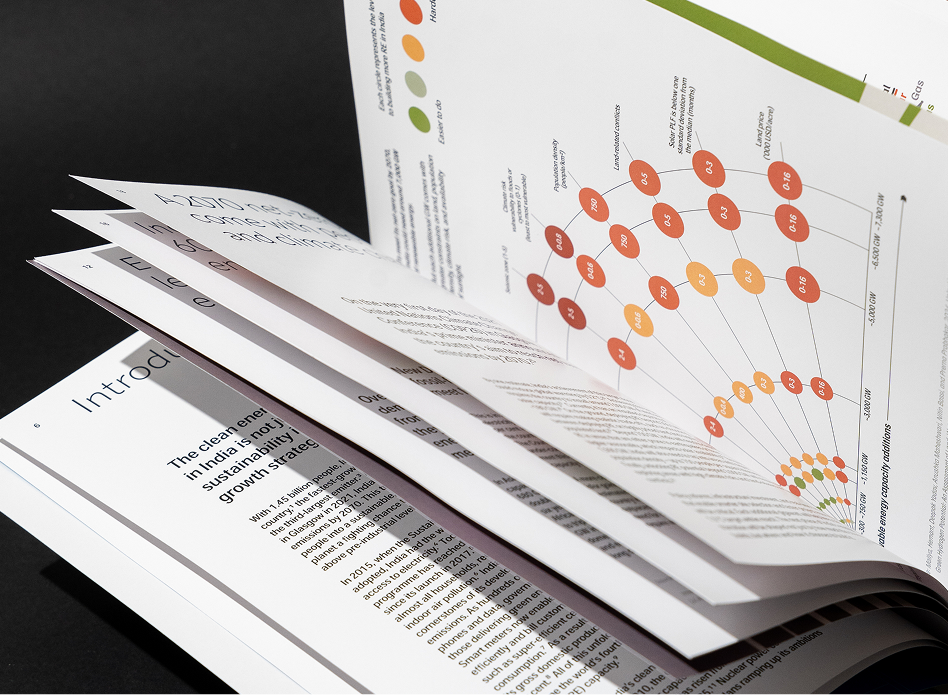
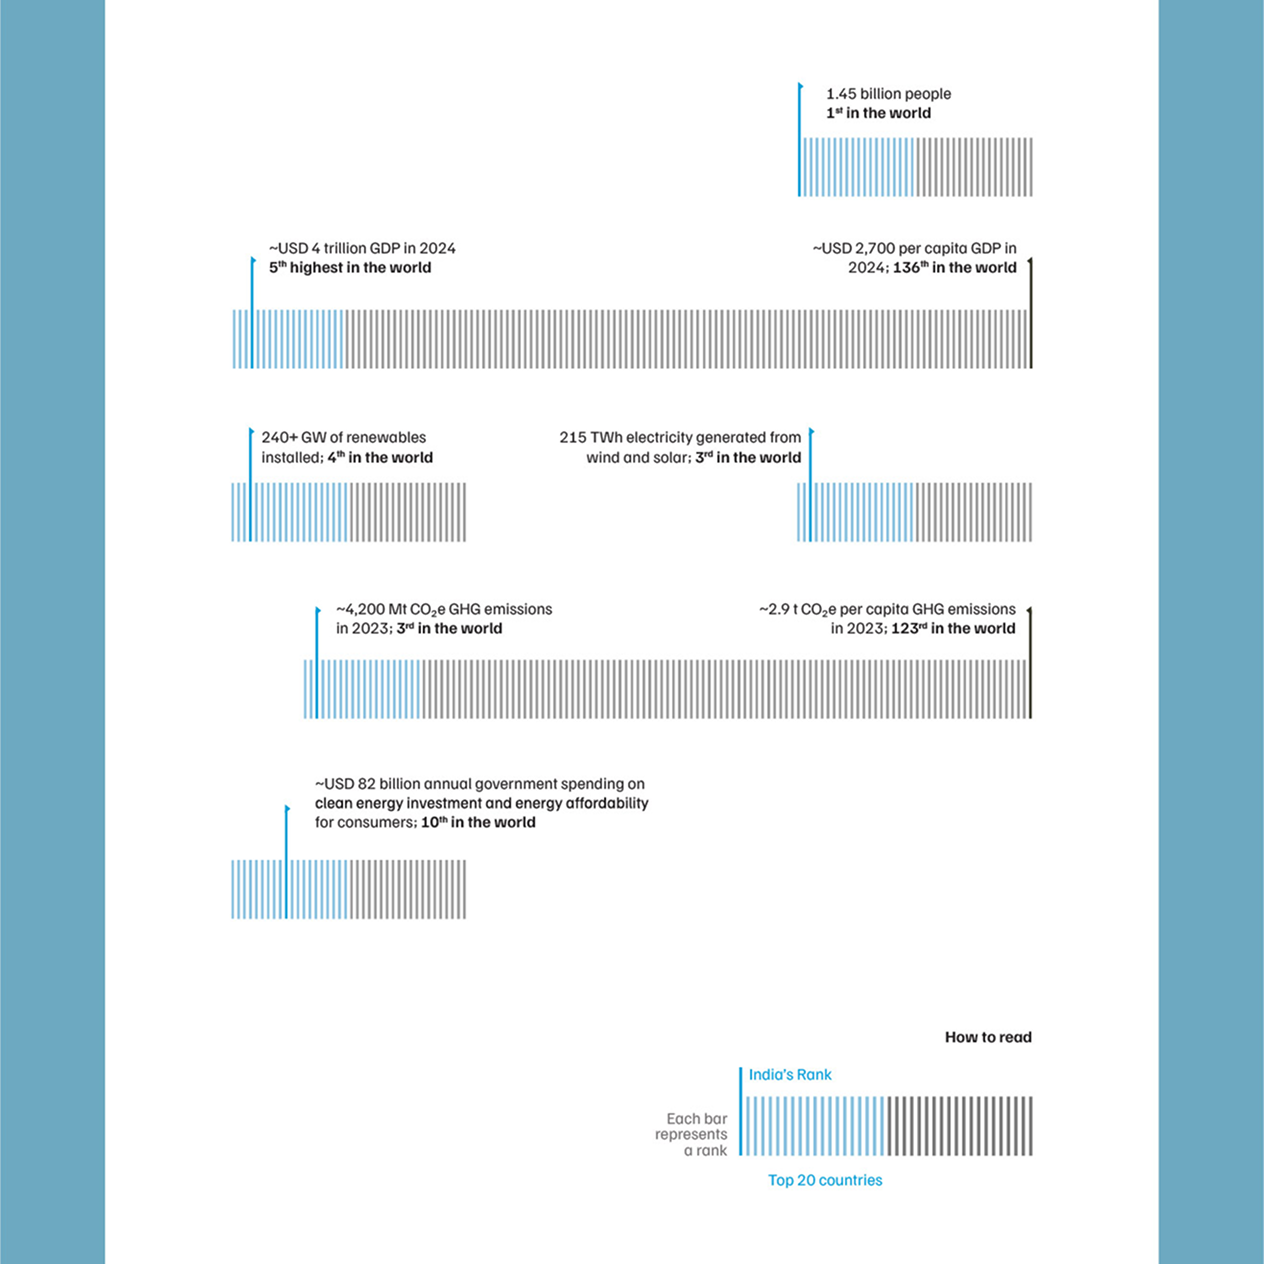
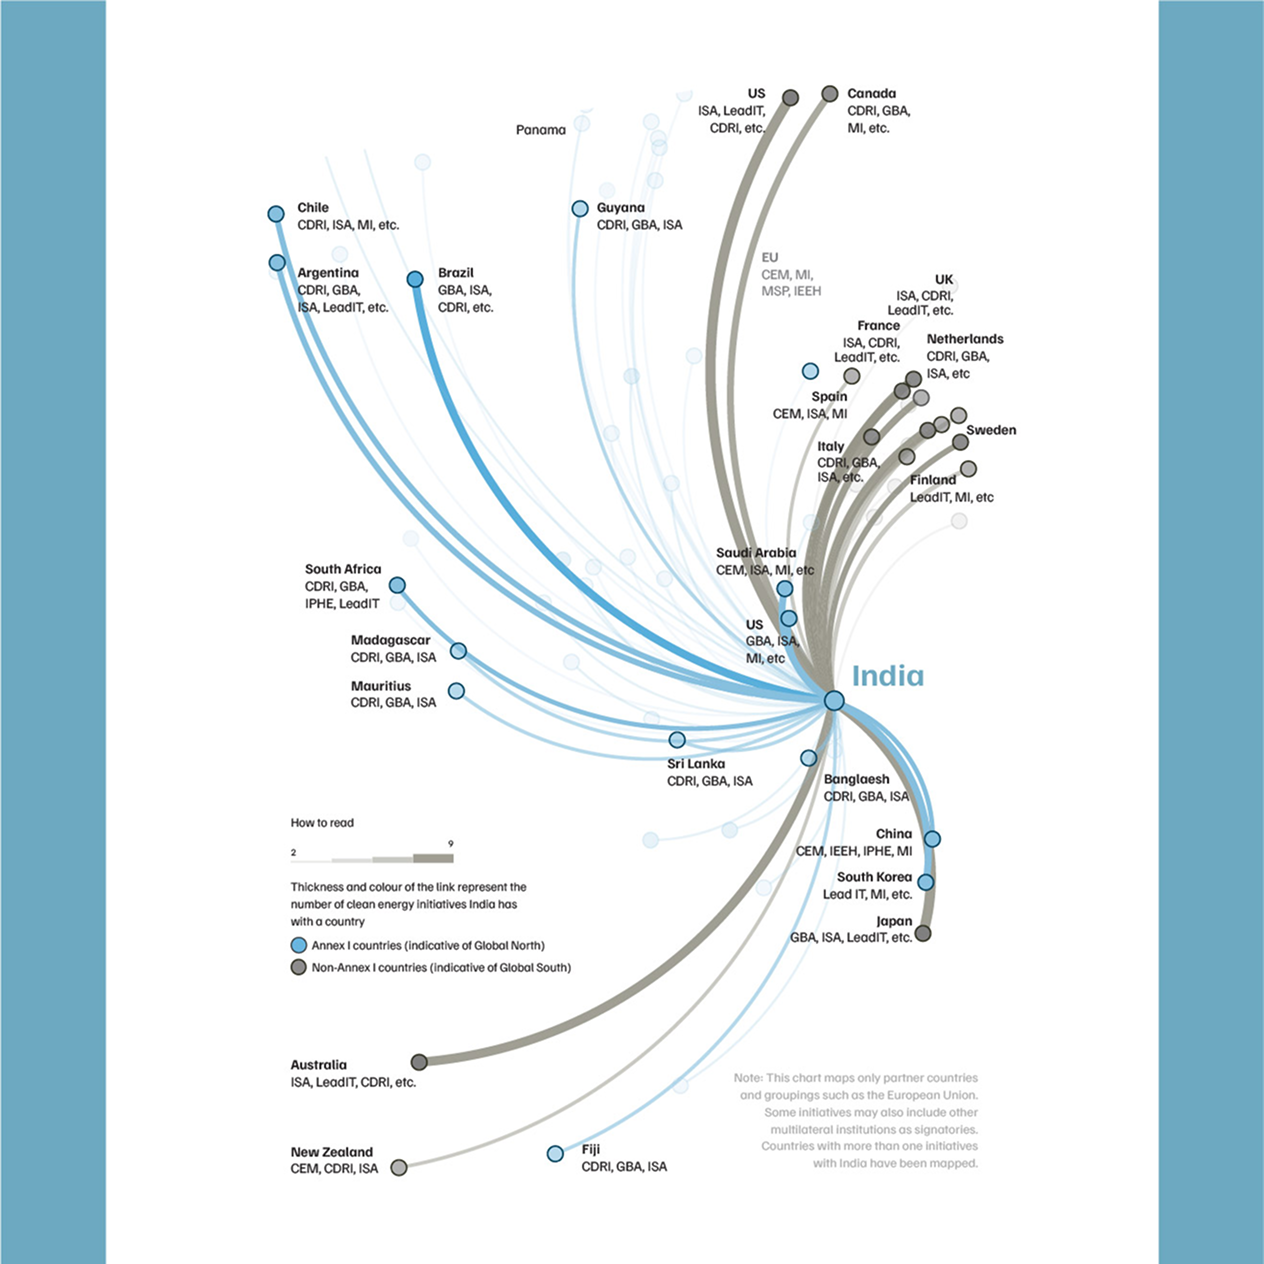
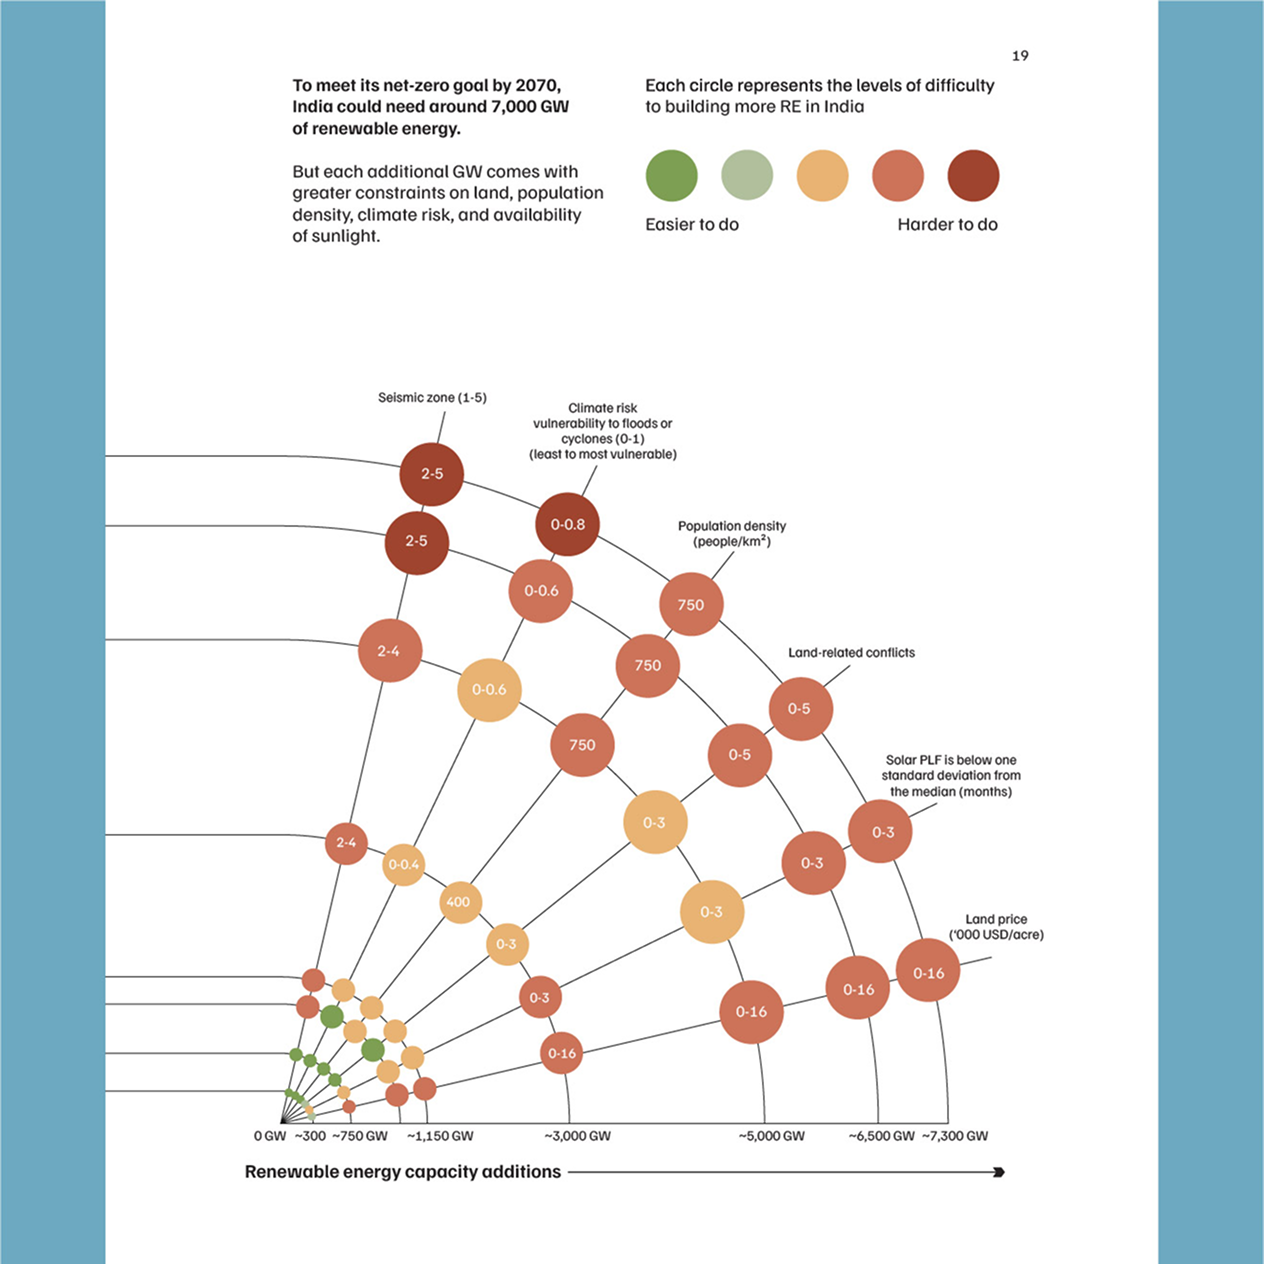
While the content rests comfortably on the left side of the spread, the right side takes full liberty to creatively organise the data charts and their annotations.
The key research writing and data charts (which makes up for most of the book), are organised in a clean manner with simple and clear visual hierarchy. Same typologies of content appear in similar places.
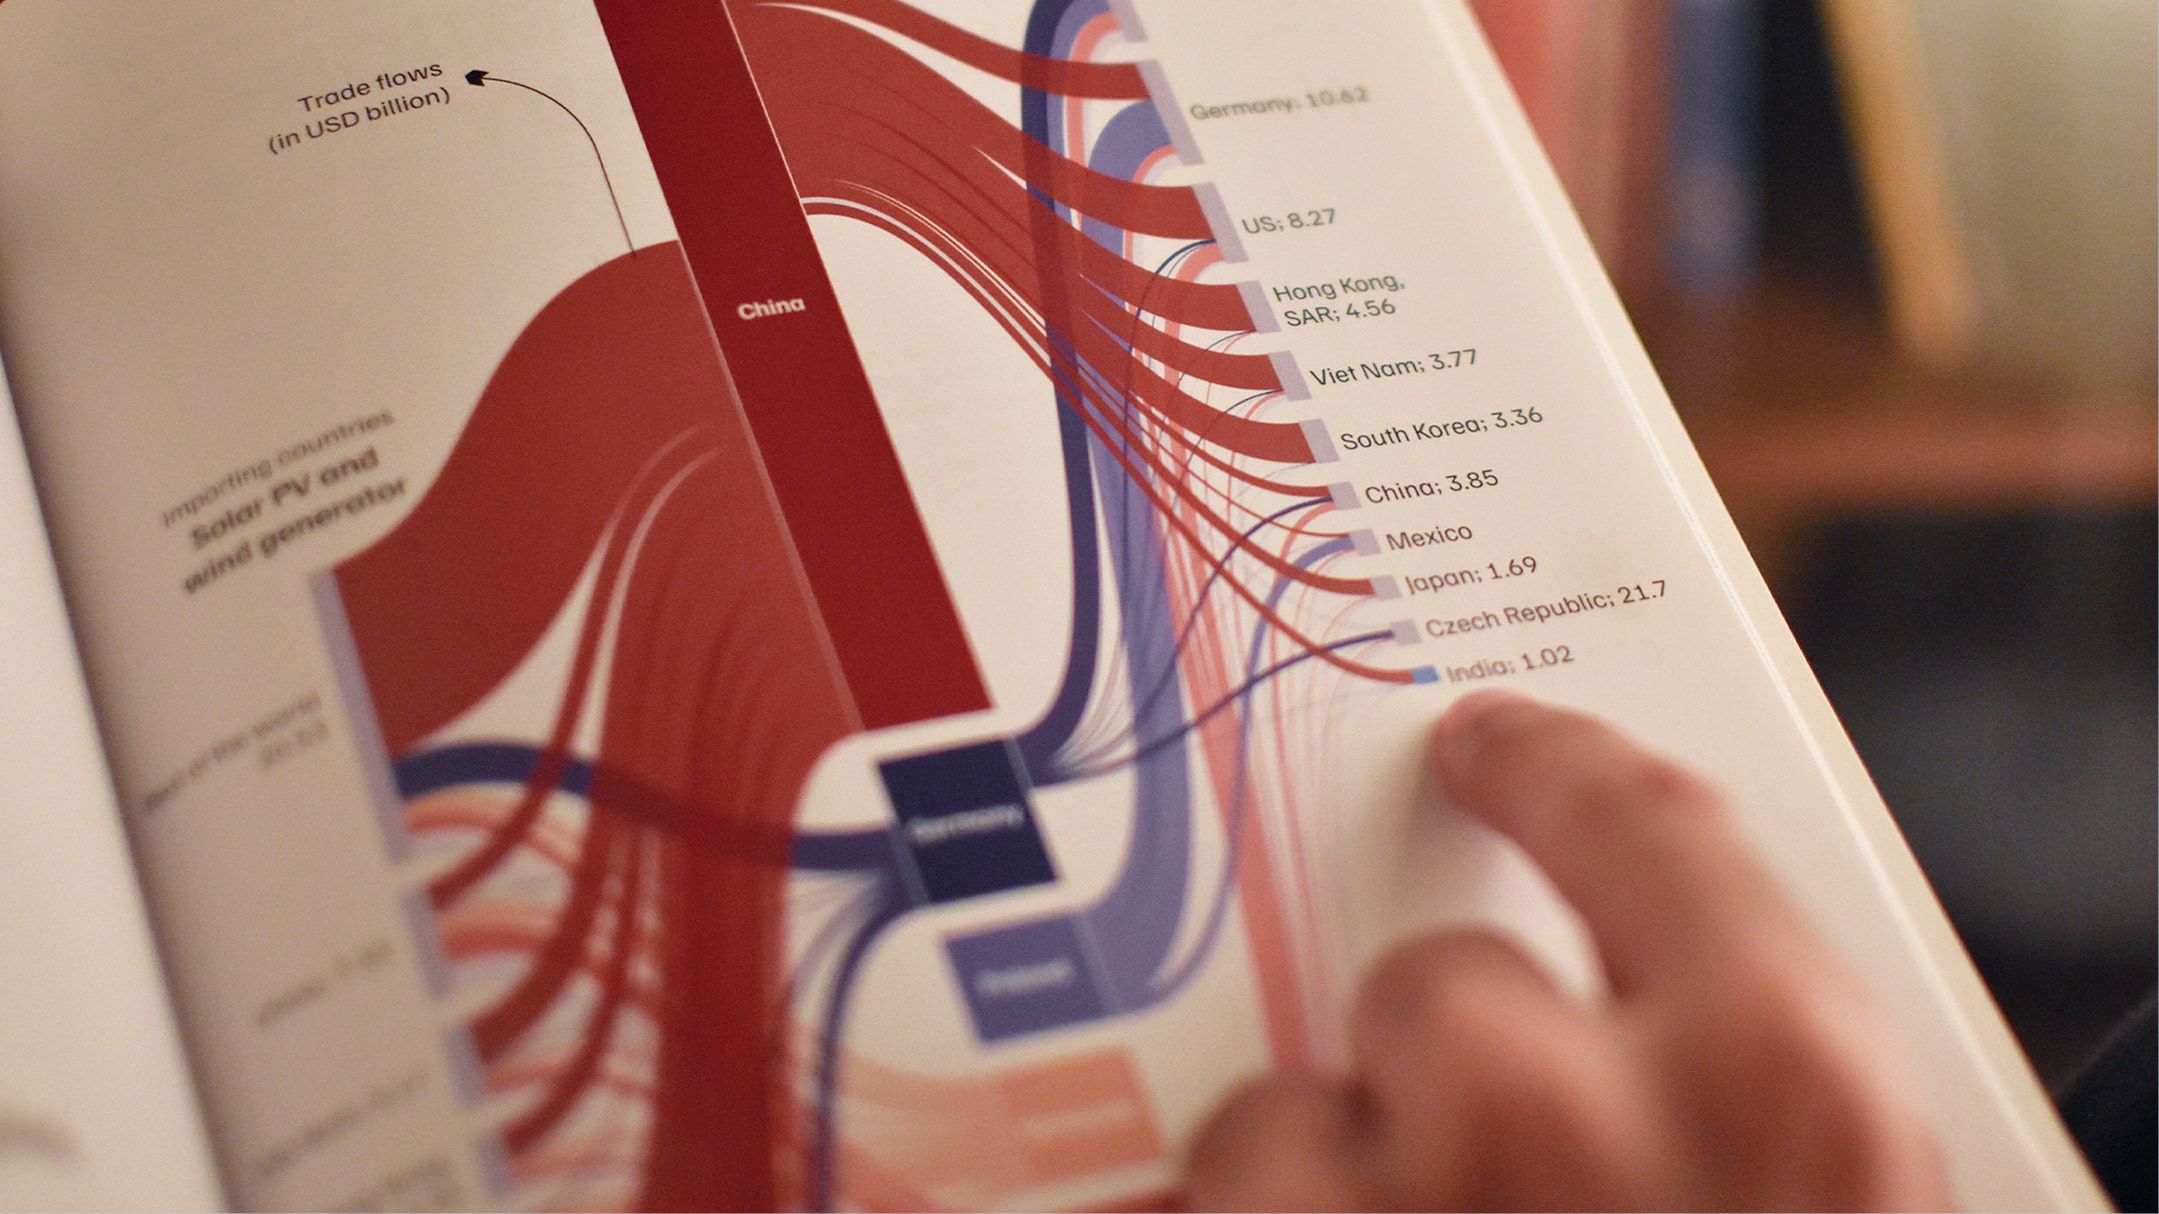
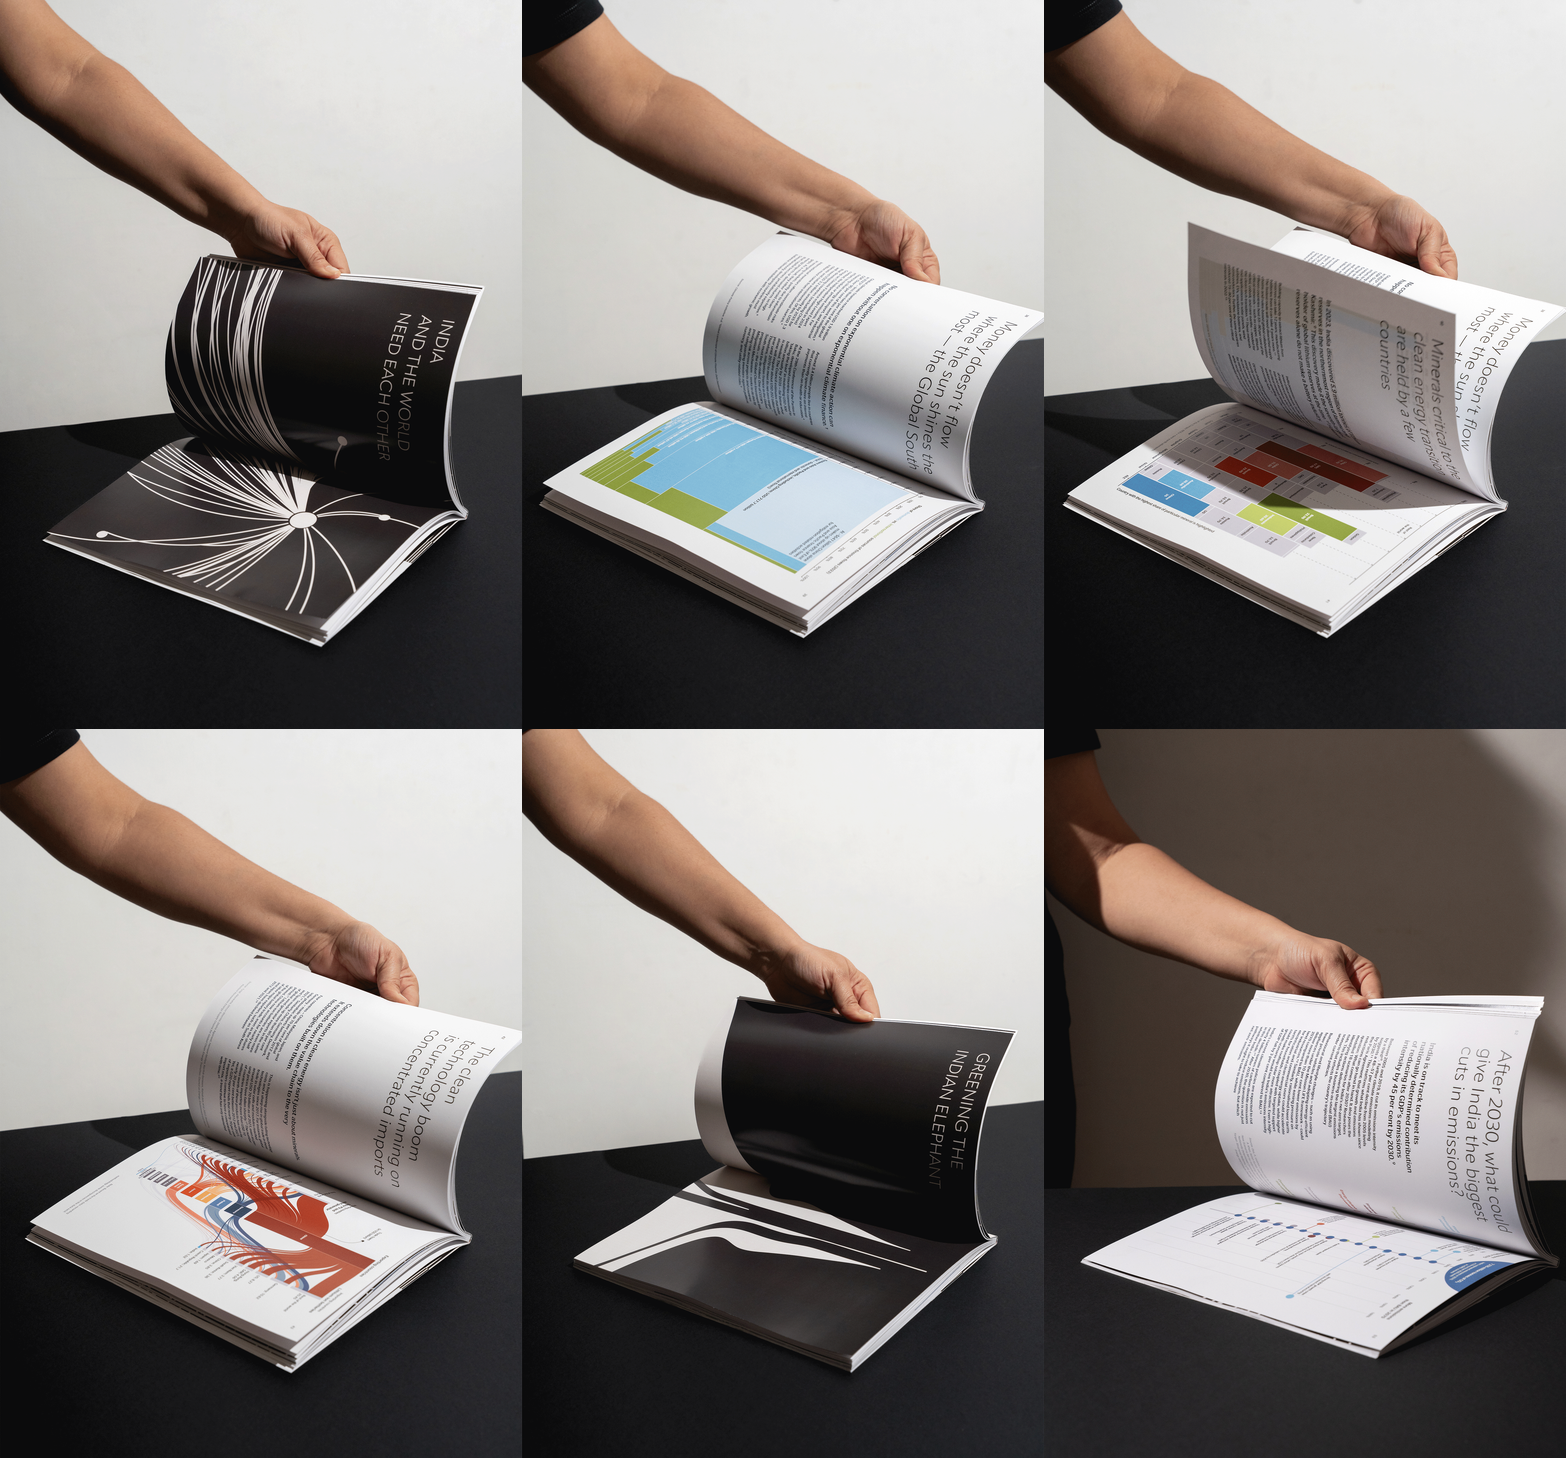
While the content rests comfortably on the left side of the spread, the right side takes full liberty to creatively organize the data charts and their annotations.
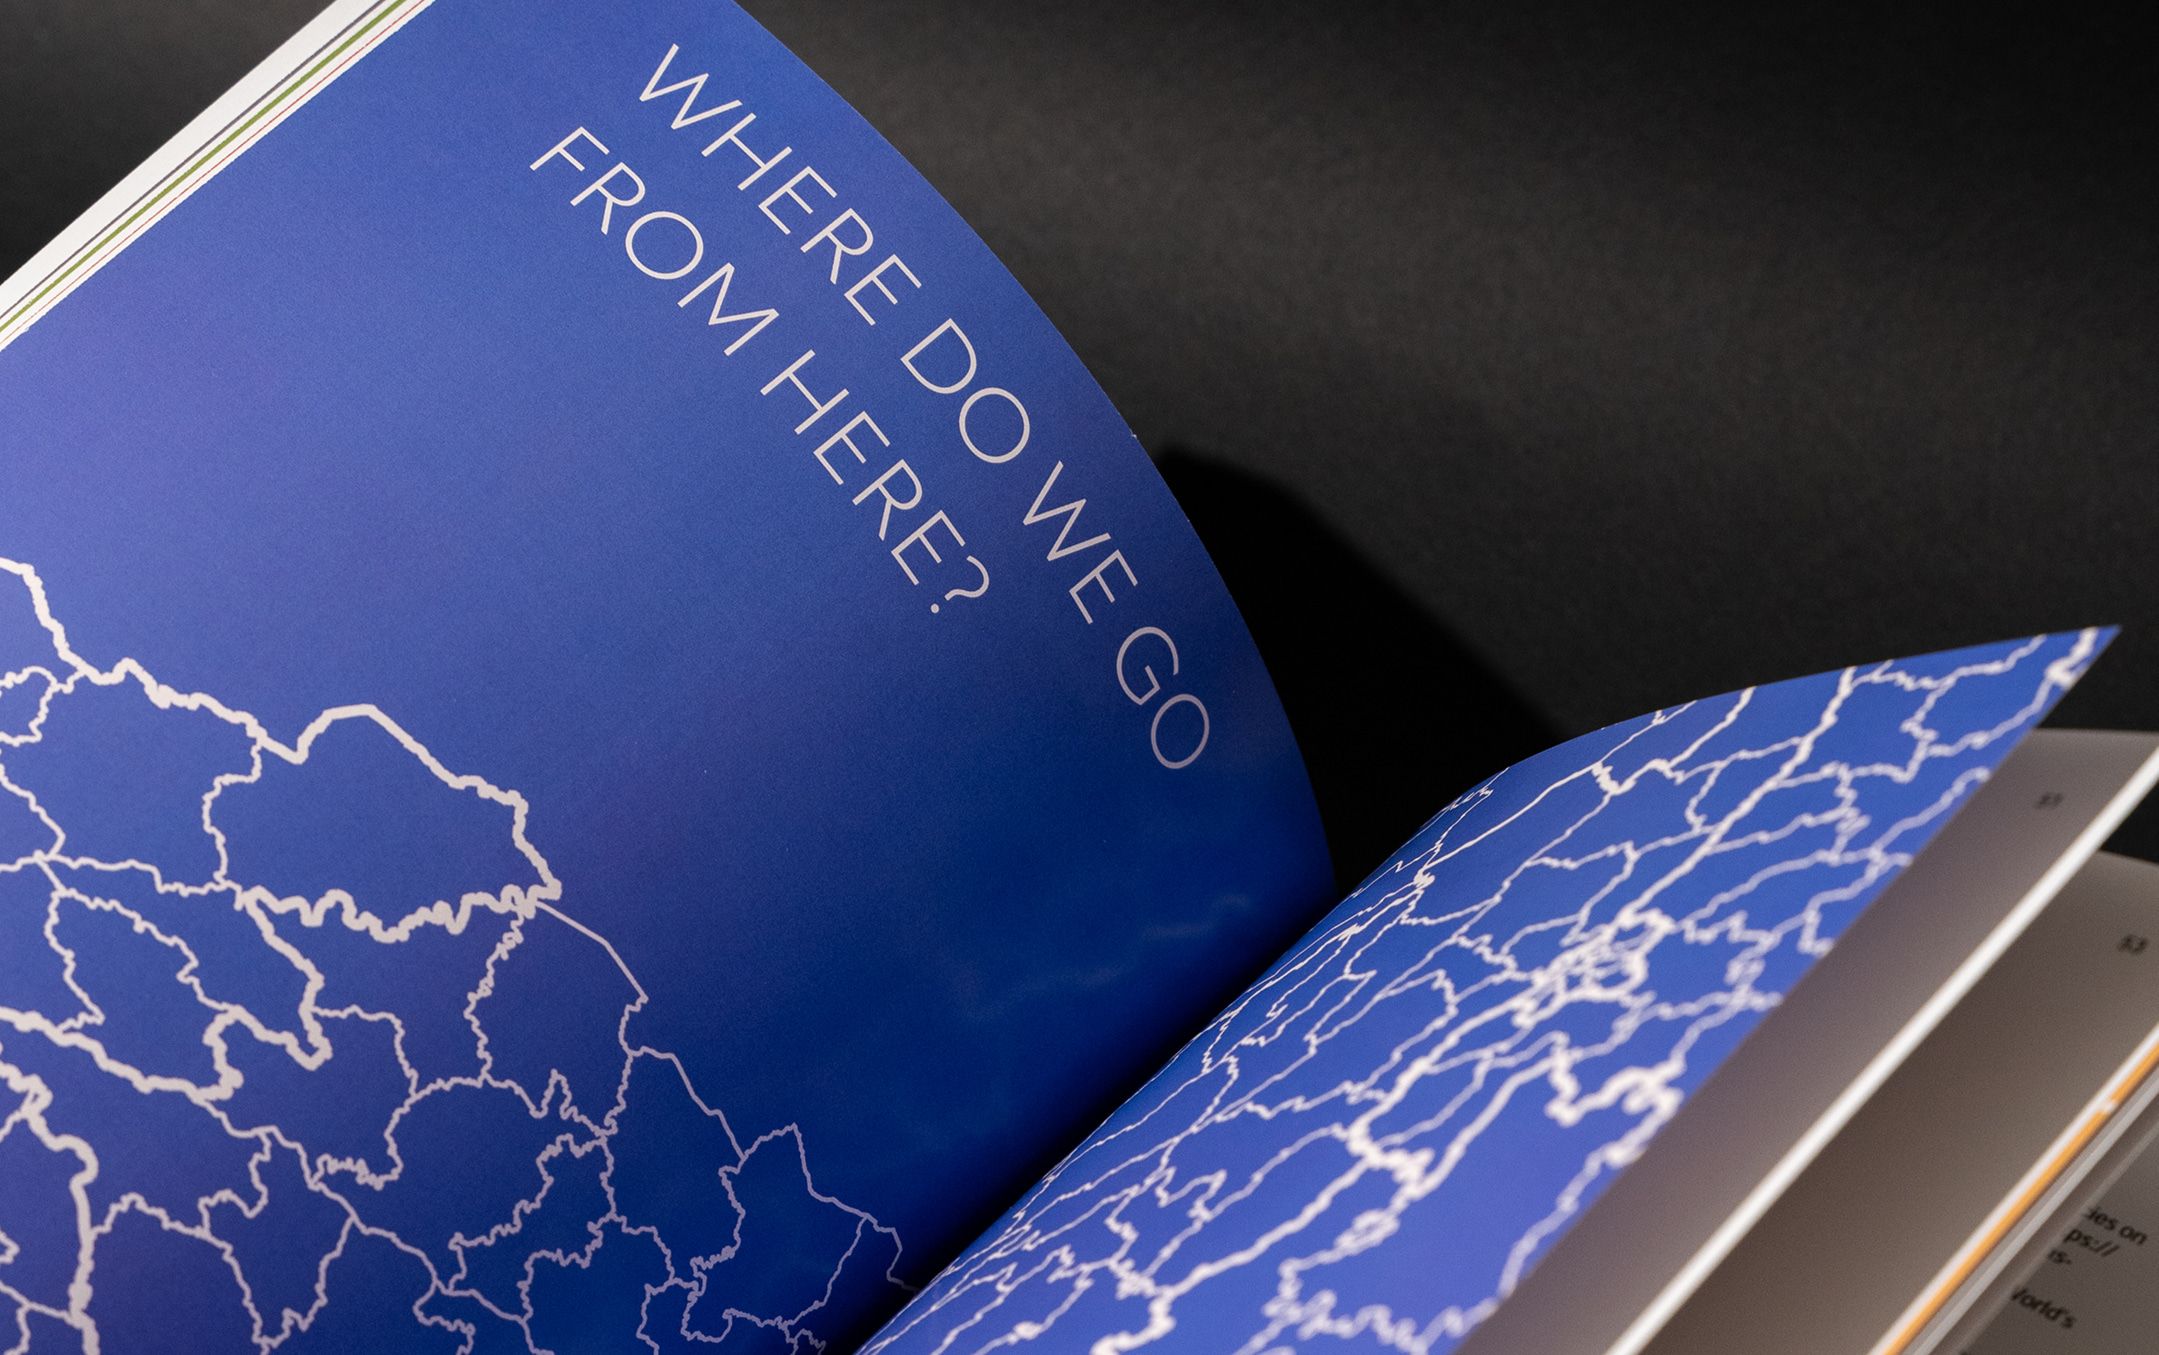
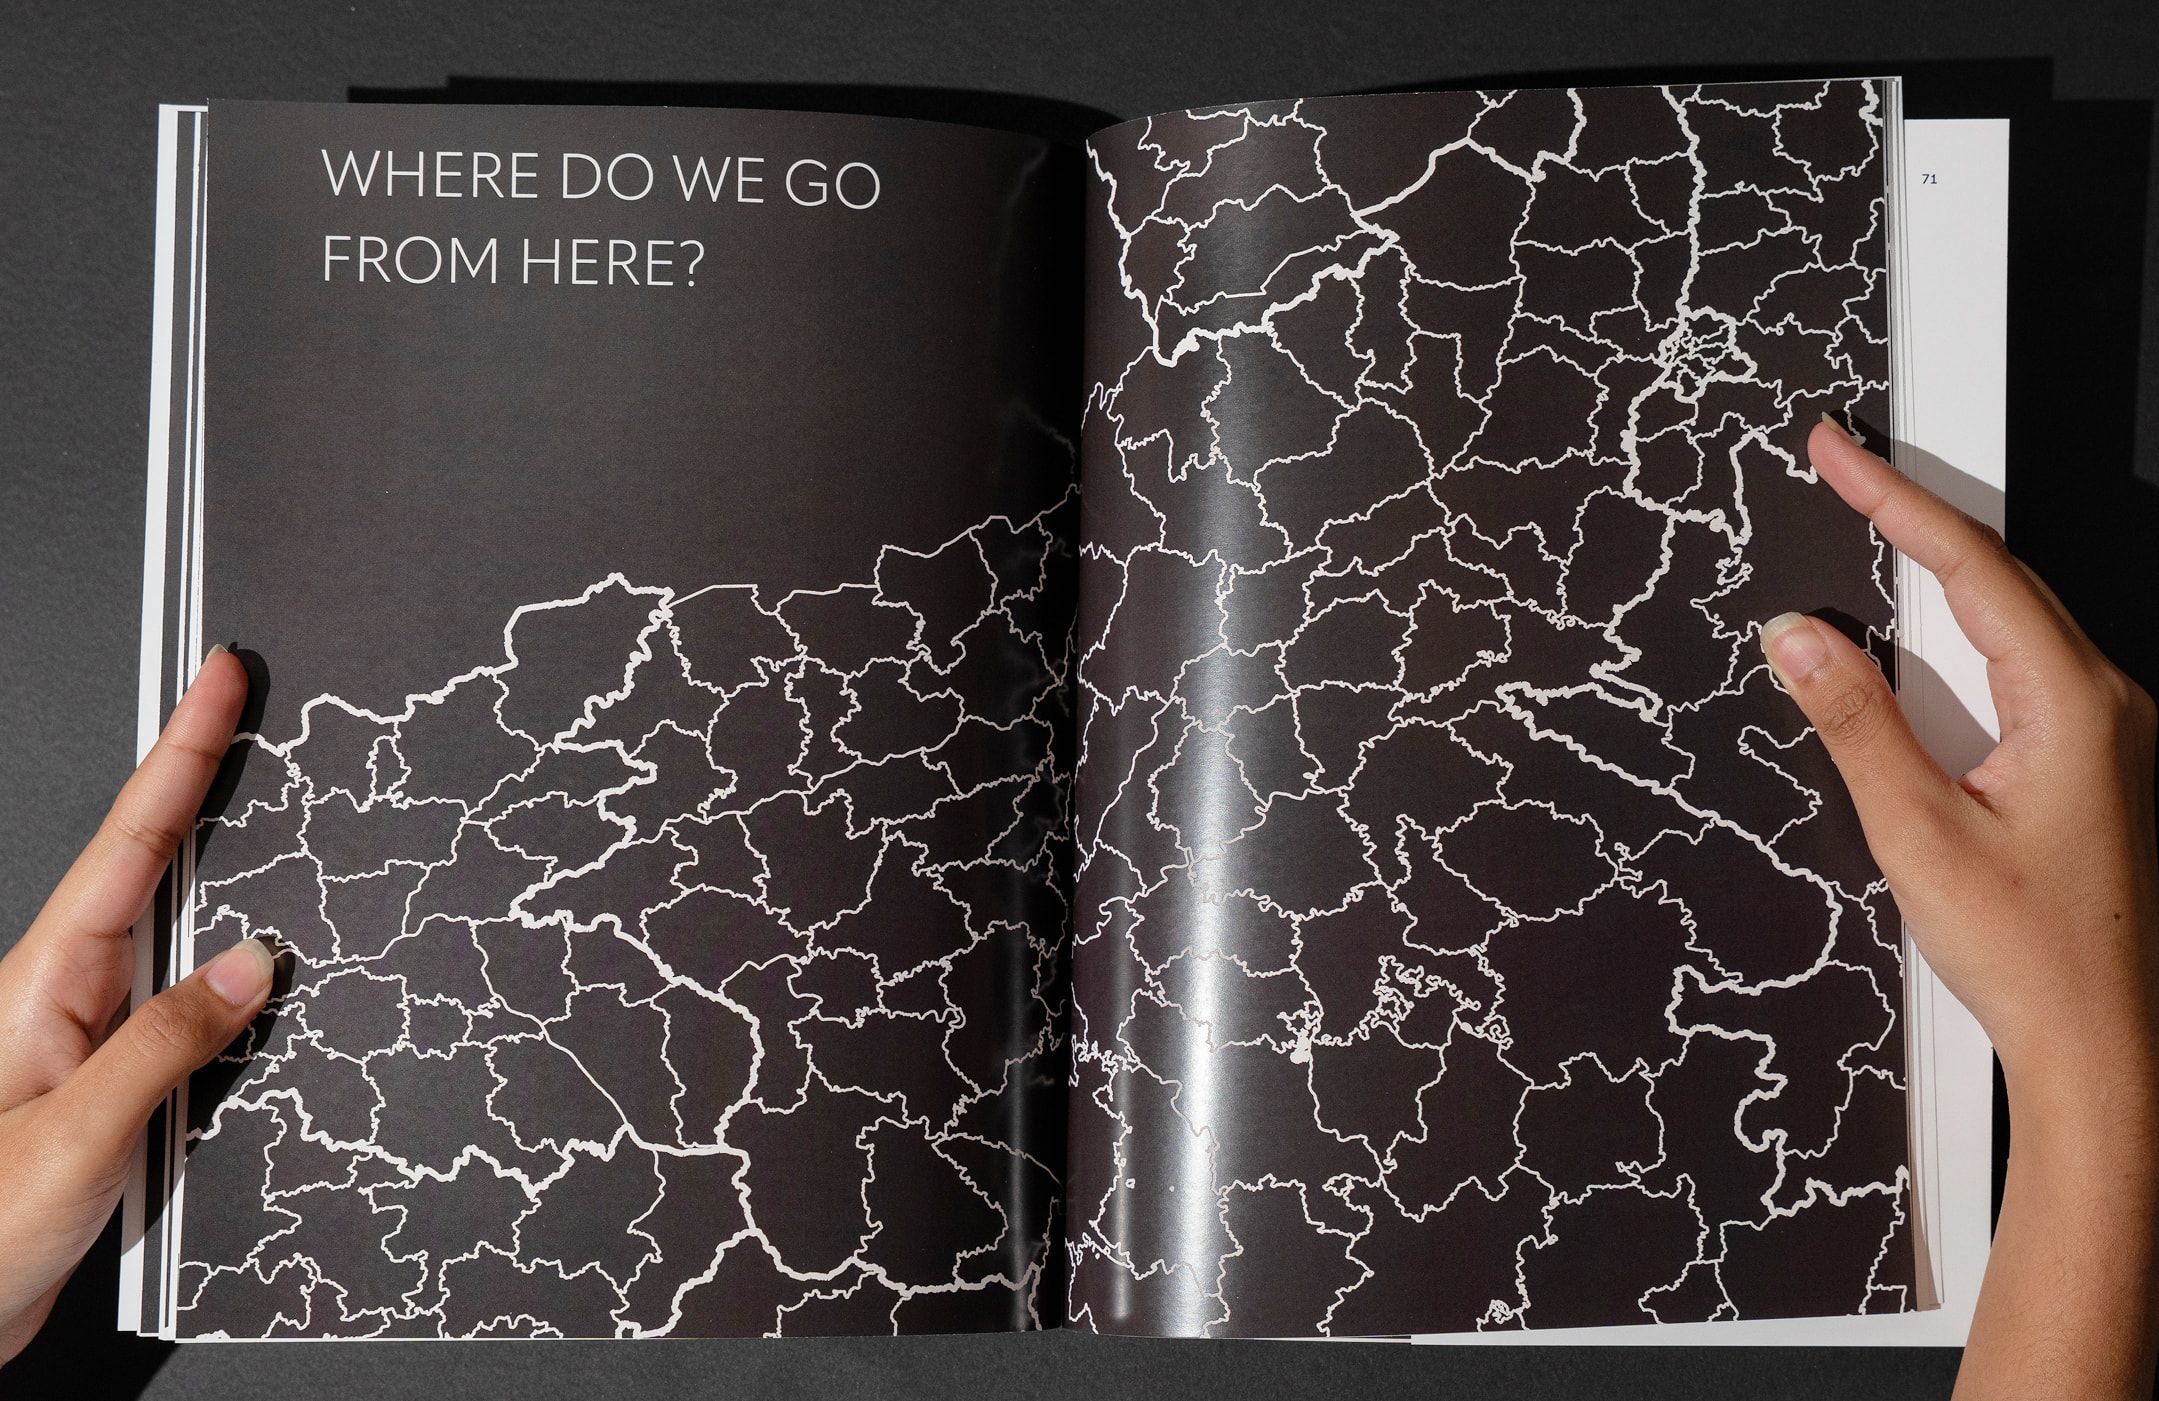
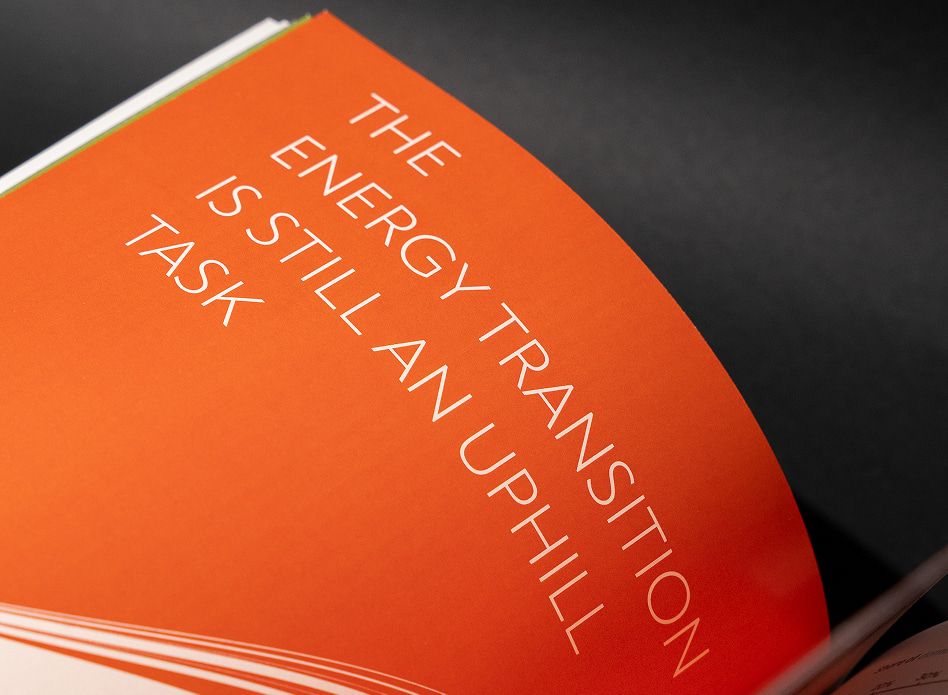
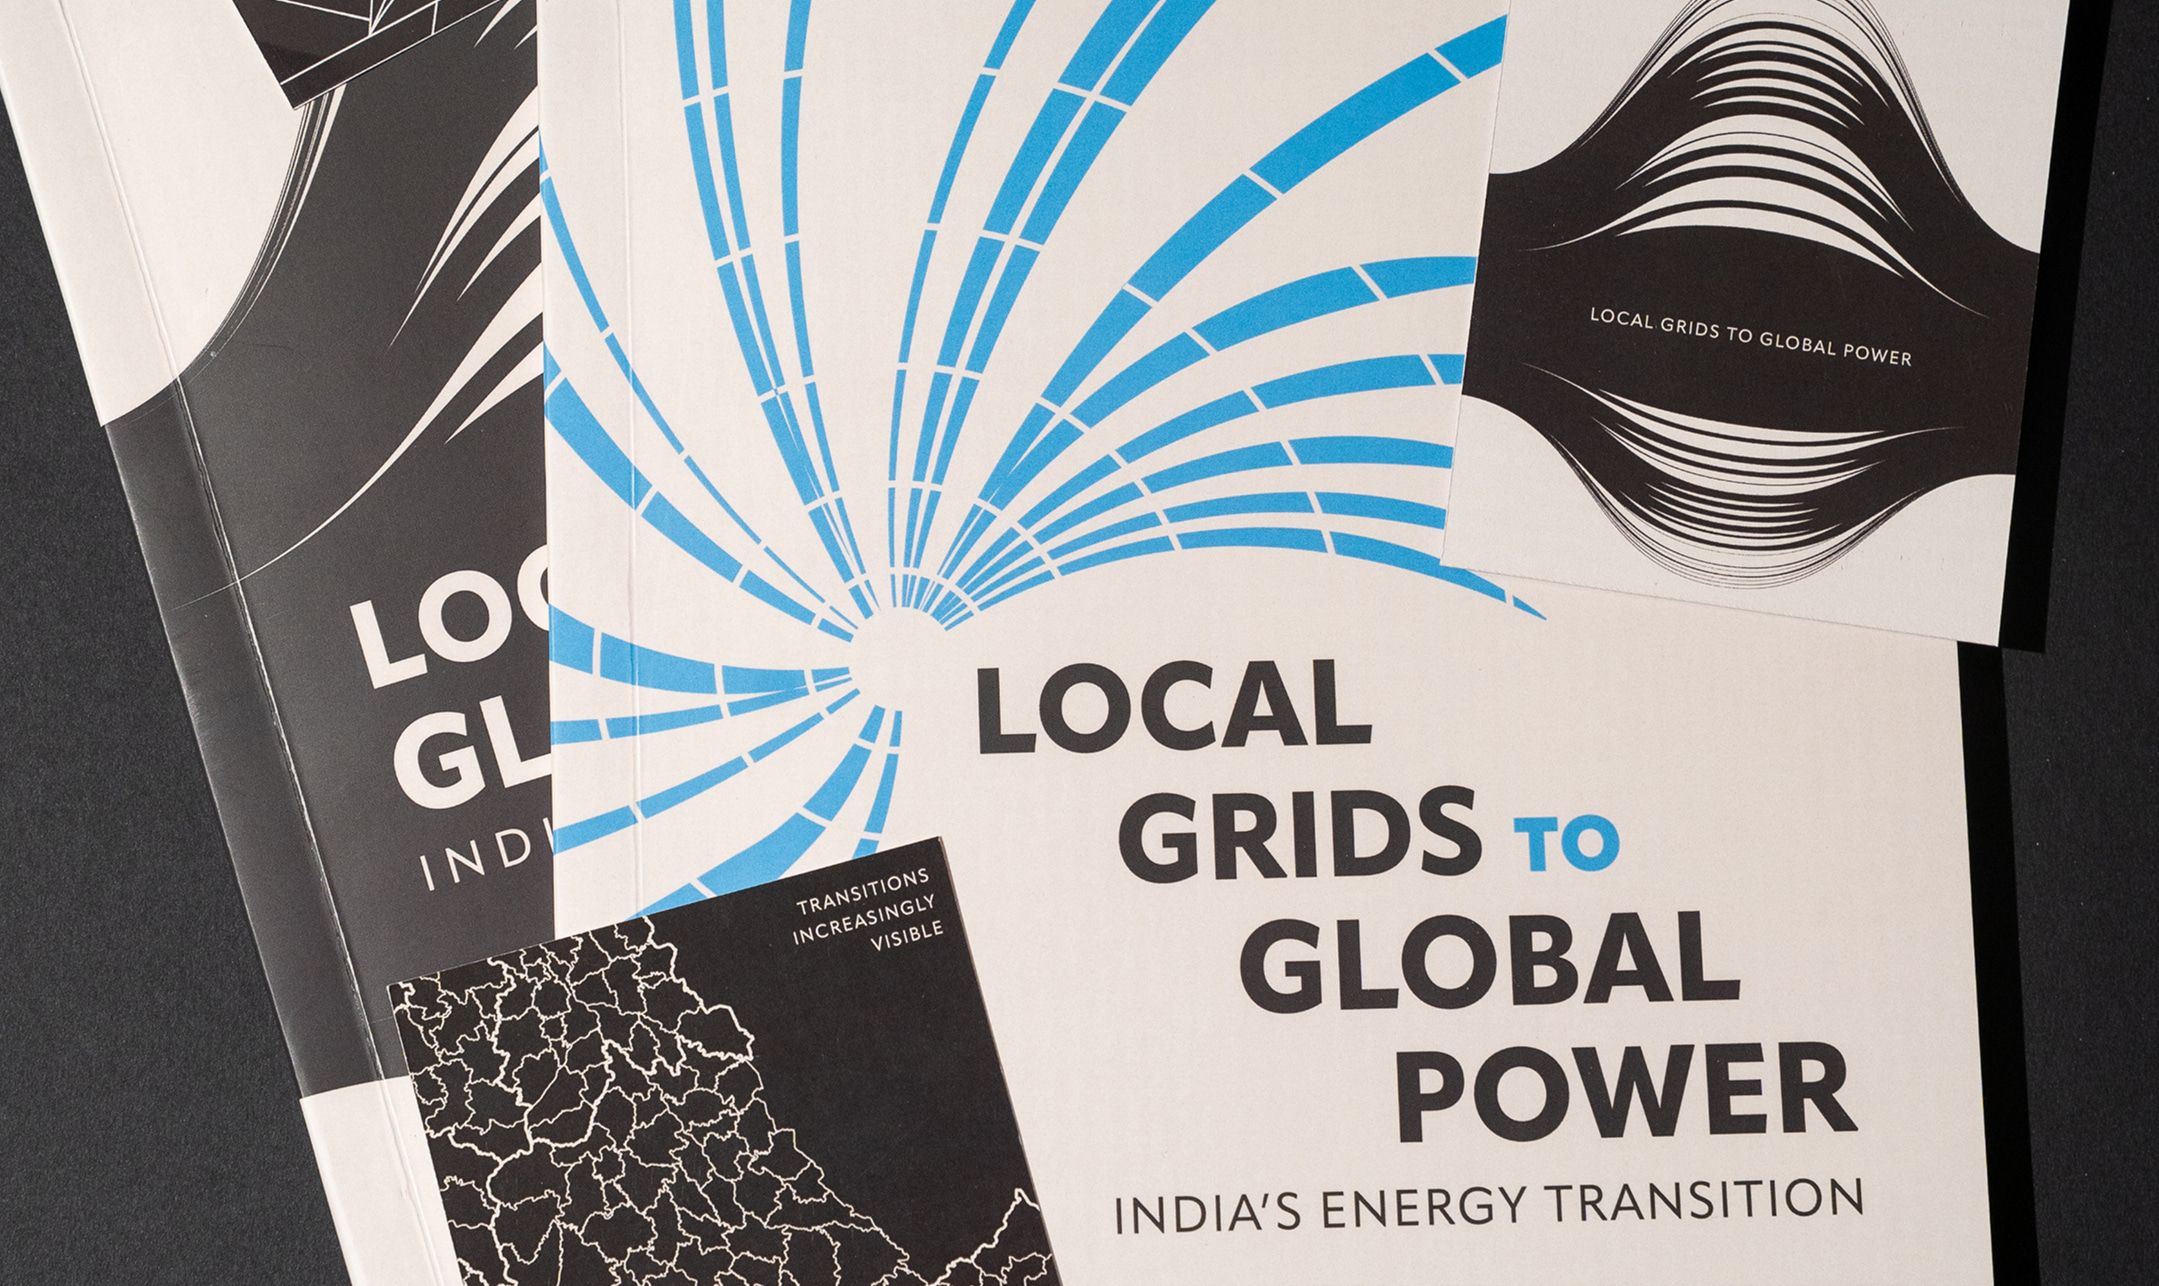
The various elements from the data charts became points of graphic exploration. We generated a range of data-led visual compositions that became section separators.
Doc Tutorials Edition 6
2026